Application Monitoring and Observability
Holistic application observability
We’ve got you covered with commercial, monolithic, N-tier, or modern micro-services-based applications with Observability by SolarWinds.
Connect and contextualize apps and services
Aggregate disparate data types supporting legacy and modern internally written applications to help troubleshoot issues faster and optimize application performance and user experience.
Expedited problem identification
Identify performance bottlenecks and pinpoint the cause of performance issues through distributed waterfall traces, exception tracking, and live code profiling.
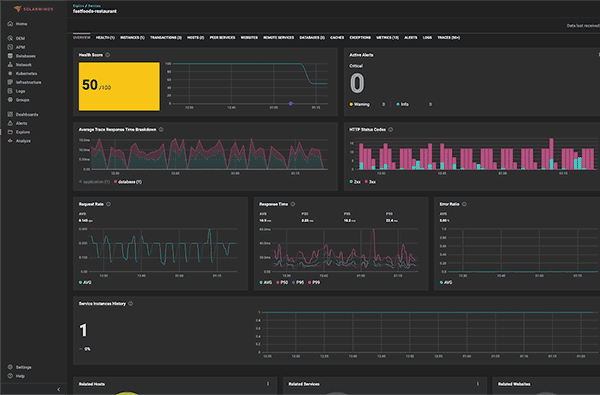
Visualize everything you need in one place
Deliver intelligent insights and increase productivity with unified data from metrics, traces, logs, database queries, and the user experience.
More time deploying, less time firefighting
Focus on innovation and feature delivery with simplified management of complex modern applications.
Managing your modern applications made easy
Comprehensive code level monitoring
- Distributed Tracing – Automatically ties together the path of an entire request into a trace waterfall.
- Live Code Profiling – Isolate performance Issues down to the line of code
- Exception Tracking - Summary of exceptions happening within a service context
Accelerate commercial application issue resolution
- Consolidated dashboard highlights performance metrics across the application stack
- Quickly pinpoint the root cause of application issues impacted by hybrid infrastructure
- End-to-end visibility regardless of where applications reside
Real-time application metrics for custom applications and services
- Broad application support for Java, Python, PHP, .Net, Node.js, Ruby, and Go Lang
- Visualize status relationships and dependencies across services, and drill down on the visualization map for details
Service health and detailed drilldowns
- Proactively monitor and observe modern distributed applications leveraging on ml-driven health scores.
- Rapidly identify which microservice, host or database is the root cause of performance issues.
- Enables fast and accurate troubleshooting to reduce MTTR
AIOps enhanced with machine learning
Move from reactive to proactive by prioritizing real problems, filtering the noise, reducing complexity, and increasing focus on urgent issues with real-time insights into the health and performance of applications and services.
Application Observability by SolarWinds
Self-hosted observability to take you from reactive to proactive across on-prem and hybrid IT environments.
- Deployment to meet your needs, whether behind your firewall or self-hosted in AWS®, Microsoft® Azure, or GCP®
- Flexible licensing – allocate nodes across multiple instances – and optimal scalability
- Built from our years of network management leadership and enhanced with machine learning
SaaS-delivered observability to simplify management of cloud-native and hybrid IT environments.
- Visibility across your hybrid IT landscape, including custom apps, microservices, Kubernetes, and containers
- Accelerate insights with unified data across metrics, traces, logs, and user experience
- Extensible with open-source framework, public API, and out-of-the-box third-party integrations
Pine Labs eliminates tool sprawl and accelerates issue resolution.
“There are out-of-box reports that are available, and the kind of reports... is quite amazing...In the longer run, we can reduce MTTD and MTTR up to 40 to 50%.” — Somil Goyal, Infra Architect, Pine Labs

See how organizations like yours have benefited from SolarWinds


Want to learn more? Check out these helpful links.
You may still have questions. We definitely have answers.